
In today’s digital landscape rapidly evolving with AI, internet traffic flows through the capillaries of platforms and devices, mirroring shifts in social activities and user behavior. With favorable policies making public mini-holidays increasingly commonplace, many employees now opt to take leave on Fridays or Mondays adjacent to weekends. This “bridge holiday” model allows them to steal a break and find some breathing room, functionally resembling traditional mini-holidays. Consequently, mini-holidays hold significant reference value for brand marketing and tourism destination planning. To gain deeper insights into user internet behavior patterns during these periods, YOYI Tech conducted a comprehensive analysis of internet traffic across four major 2025 mini-holidays: New Year’s Day, Qingming Festival, Labor Day, and Dragon Boat Festival.
The four sampled mini-holidays exhibit diverse durations, ranging from 1 to 5 days:
- New Year’s Day (Jan 1): A standalone mid-week holiday on Wednesday.
- Qingming Festival (Apr 4–6): A 3-day break spanning Saturday to Monday.
- Labor Day (May 1–5): An extended 5-day period including a weekend.
- Dragon Boat Festival (May 31–Jun 2): A 3-day holiday incorporating a weekend.
This variety of holiday structures—differing in length and timing—provides multifaceted samples for analyzing user internet behavior across distinct vacation scenarios.
01 Mini-Holiday Recharge: Seeking Work-Life Balance
According to traffic data from YOYI TECH’s DNA platform, during these mini-holidays, OTT devices captured 11% of traffic, primarily reflecting entertainment beyond work contexts, especially family-centric activities like TV series watching and big-screen gaming. Mobile devices dominated with an overwhelming 80% share, functioning mainly as entertainment hubs while accommodating limited non-entertainment scenarios (e.g., remote work/learning). PCs accounted for 9% of traffic, largely serving non-entertainment purposes such as work and study. Some users continued handling work assignments and academic tasks even during breaks. Notably, despite smartphones’ entertainment supremacy, a significant user segment actively pursued personal growth and career advancement.
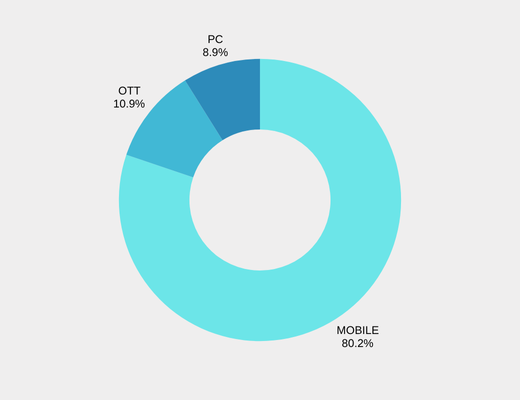
Table 01: 2025 H1 Mini-Holiday Traffic Distribution by Device, Data Source: YOYI TECH DMP
02 Mini-Holiday Attributes & Duration: Core Drivers of User Behavior
Drilling deeper into individual holidays, YOYI observed elevated OTT traffic during Labor Day and New Year’s Day—directly correlated with concentrated premieres of May Day and New Year seasonal film and TV releases. As a symbolically significant year-start milestone, New Year’s Day saw more families, couples, and friends opting for at-home TV celebrations—notably countdown events and leisure viewing. Concurrently, these two mini-holidays recorded peak PC usage, reflecting greater demand for clearing work backlogs and academic tasks. New Year’s Day fell precisely on the pivotal point of the week – Wednesday – while the Labor Day holiday spanned five days, making it relatively longer. Consequently, users needed to account for more variables arising from non-leisure scenarios like work and studies when planning their holiday arrangements.
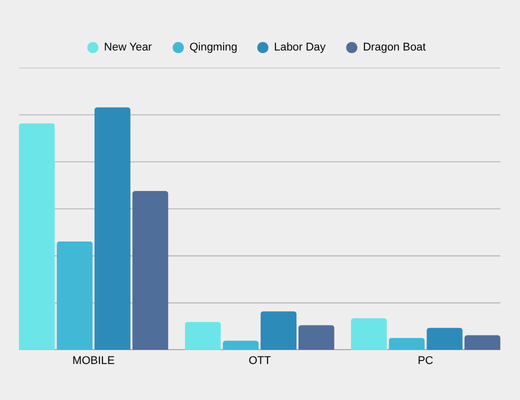
Table 02: 2025 H1 Daily Mini-Holiday Traffic Distribution by Device, Data Source: YOYI TECH DMP
During Qingming Festival, mobile and OTT traffic dipped to their lowest levels among all holidays—a direct reflection of outdoor traditions like spring outings and ancestral rites, which naturally subdued entertainment engagement. During the Dragon Boat Festival, entertainment scenarios represented by OTT and mobile devices, and work and study scenarios represented by PCs, showed a relatively balanced distribution. While gathering with family and enjoying festival traditions, people relaxed using phones and TVs, while also moderately attending to work and studies via computers.
03 Daily Traffic Patterns: Dual Evening Peaks on New Year’s Day
Analyzing overall daily traffic trends across the four mini-holidays, YOYI observed consistent pre-dawn troughs (0-6 AM). As mornings progressed (6-9 AM), traffic gradually ascended—likely driven by early risers checking updates and planning daily itineraries. Steady growth continued through late morning (9 AM-12 PM), followed by a mild midday dip (12-2 PM) during lunch breaks.
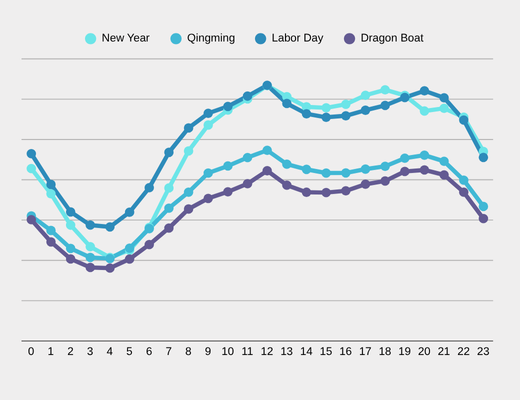
Table 03: 2025 H1 Full-Day Mini-Holiday Internet Traffic Flow Patterns (Daily Average), Data Source: YOYI TECH DMP
From 2 PM to 8 PM, traffic resurged, peaking around 20:00 as dependency on digital resources intensified for work and study tasks. Distinctively, New Year’s Day exhibited dual evening peaks: the first arriving 2 hours earlier at 18:00, followed by a secondary uptick (20:00–21:00)—a unique phenomenon tied to pre-dinner gatherings and celebration preparations absent in other holidays. Post-21:00, traffic gradually declined across all four holidays, signaling users’ transition toward rest after outdoor activities. Collectively, New Year’s Day and Labor Day recorded higher daily traffic volumes; the former leveraged its distinctive commemorative significance, while the latter’s extended duration created pivotal windows for brands to capture concentrated online engagement.
04 Video, Reading & Social: The Triple Traffic Anchors of Mini-Holidays
Among the top 10 media types by daily traffic during mini-holidays, video platforms dominated with 49% share, fulfilling heightened entertainment demand through short videos, series, films, and variety shows. Social networks followed at 20%, channeling holiday experience sharing and social interactions. Digital reading platforms captured 8% as the third anchor,, validating users’ essential self-improvement needs. The remaining Top 10 slots were claimed by lifestyle services, photo enhancement tools, music/podcast platforms, news outlets, utility apps, travel services, and family-focused content, collectively reflecting user’s integrated demands for daily convenience, moment preservation, leisure travel, and real-time information access.
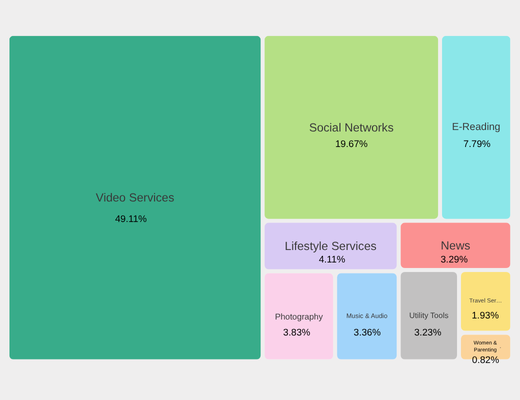
Table 04: Top 10 Media Types During 2025 H1 Mini-Holidays, Data Source: YOYI TECH DMP
The Top 10 media types exhibited distinct daily traffic fluctuations across mini-holidays, reflecting dynamic interplays between holiday attributes and user needs. Video service traffic surged significantly during New Year’s Day and Labor Day compared to Qingming and Dragon Boat Festivals. As a symbolic year-start milestone, New Year’s Day saw platforms concentrating premium content like gala broadcasts and new-year series premieres, aligning with home-based entertainment demands for year-end celebrations. Meanwhile, the extended 5-day Labor Day break fostered multi-scenario video consumption—whether at home or during travel—propelling traffic growth. Conversely, Qingming and Dragon Boat Festivals recorded traffic dips as outdoor ritual activities (ancestral rites/dragon boat racing) dominated, prompting users to step away from immersive screens temporarily.
Labor Day witnessed the most pronounced digital reading traffic surge. The extended 5-day break propelled users’ self-enhancement and planning pursuits, driving engagement with e-books and knowledge columns—while also capitalizing on fragmented intervals during transit. This precisely met lightweight knowledge acquisition demands, catalyzing distinctive traffic growth.
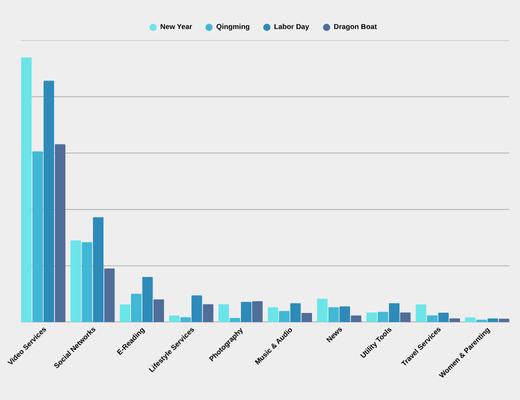
Table 05: 2025 H1 Top 10 Media Daily Traffic Distribution During Mini-Holidays, Data Source: YOYI TECH DMP
For social platforms, Labor Day traffic peaked—fueled by extended break duration and diverse activities that spurred frequent check-in sharing and intensified interaction needs, while utility-driven engagements like bridge-holiday hacks and travel coordination further amplified usage. Conversely, Qingming and Dragon Boat Festivals saw dispersed social demand and lower traffic due to shorter durations and ritual-focused engagements.
Regarding lifestyle services, Labor Day maintained dominance with Dragon Boat Festival trailing closely. The 5-day Labor break propelled consumption scenarios (food delivery, home services, ticketing, transport), becoming key traffic drivers. Meanwhile, Dragon Boat Festival generated robust demand through ritual-themed commerce (zongzi, mugwort, dragon-boat gear) and excursion logistics, sustaining elevated traffic.
05 Overseas Travel: Asian Dominance with Neighbor Focus
During 2025 H1 mini-holidays, outbound traffic revealed a “Asia-centric, neighbor-prioritized” pattern. Asia captured an absolute majority at 50% traffic share, with high-density clusters in Southeast Asia (33.78%) and East Asia (15.43%). On one hand, within Southeast Asia, countries like Indonesia, Thailand, and Malaysia showed the highest traffic concentration. Attracting users with their “travel value-for-money + geographical convenience,” they aligned perfectly with the short, sharp getaway rhythm of mini-holidays. On the other hand, in East Asia, Japan and South Korea emerged as major traffic hotspots. With dense direct flight networks and high cultural compatibility, they became users’ top choice for light-planning, experience-focused trips.
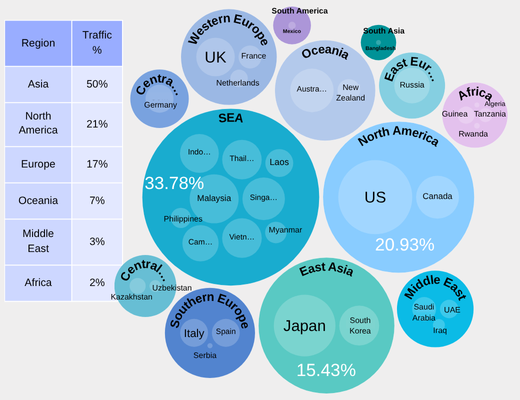
Table 06: 2025 H1 Outbound Traffic Statistics for Top 30 Countries During Mini-Holidays, Data Source: YOYI TECH DMP
In secondary markets, the Americas captured 21% of traffic—primarily driven by the business-leisure duality in the United States and Canada. During mini-holidays, some business travelers bridged work commitments with leisure time. Combined with North America’s diverse natural landscapes and urban experiences, this attracted medium-to-long trip vacationers. Europe accounted for 17% of cross-border travel traffic during mini-holidays, with Western European nations like the UK and France, alongside Southern European destinations such as Italy and Spain, making the list. However, due to distance and complex visa requirements, its traffic share lagged behind Asia, better suiting travelers seeking extended-vacation long-haul trips.
The regional distribution of outbound traffic fundamentally reflects the alignment between mini-holiday time constraints and destination attributes. Given the compressed holiday duration, travelers gravitate toward destinations with shorter flight durations and streamlined itineraries—naturally positioning Asian neighbors as optimal choices. Meanwhile, experience-specific synergies emerge: Southeast Asia’s tropical leisure pursuits, East Asia’s cultural tourism consumption, and Euro-American deep-immersion offerings precisely cater to divergent holiday expectations. Moreover, Asia’s comparative cost advantages—in transportation, expenditure, and visa accessibility—reduce both economic and temporal investments, further reinforcing its gravitational pull on traffic concentration.
Asia’s neighboring destinations function as the absolute core of mini-holiday outbound traffic—an inevitable outcome of travelers prioritizing brief duration, low barriers, and high-impact experiences. Consequently, to strategically capture this demand, Asian destinations must enhance frictionless last-minute travel products, while long-haul locales like Europe and America should focus on bridge-holiday augmented deep-dive journeys, thereby precisely converting traffic potential into market value.
Conclusion
The internet traffic patterns during the 2025 H1 mini-holidays unveiled multifaceted characteristics across device usage, daily flow trajectories, media engagement, and outbound mobility. Key insights are summarized below:
01 Users balanced leisure and work during mini-breaks at a 9:1 ratio, actively pursuing work-life equilibrium.
02 Holiday attributes and duration significantly influenced user behavioral decisions.
03 Twin traffic peaks emerged on New Year’s Eve, presenting critical moments for concentrated brand campaigns and online traffic capture.
04 Video content, digital reading, and social networks formed the three core traffic drivers.
05 Cross-border travel trended toward Asian neighbors predominantly, with Americas/Europe as supplementary long-haul destinations.
These traffic patterns provide vital references for brand marketing, destination promotion, and digital content creation, empowering industries to precisely align with user needs and develop market-responsive strategies.
Source of featured image: Photo by Kylo on Unsplash